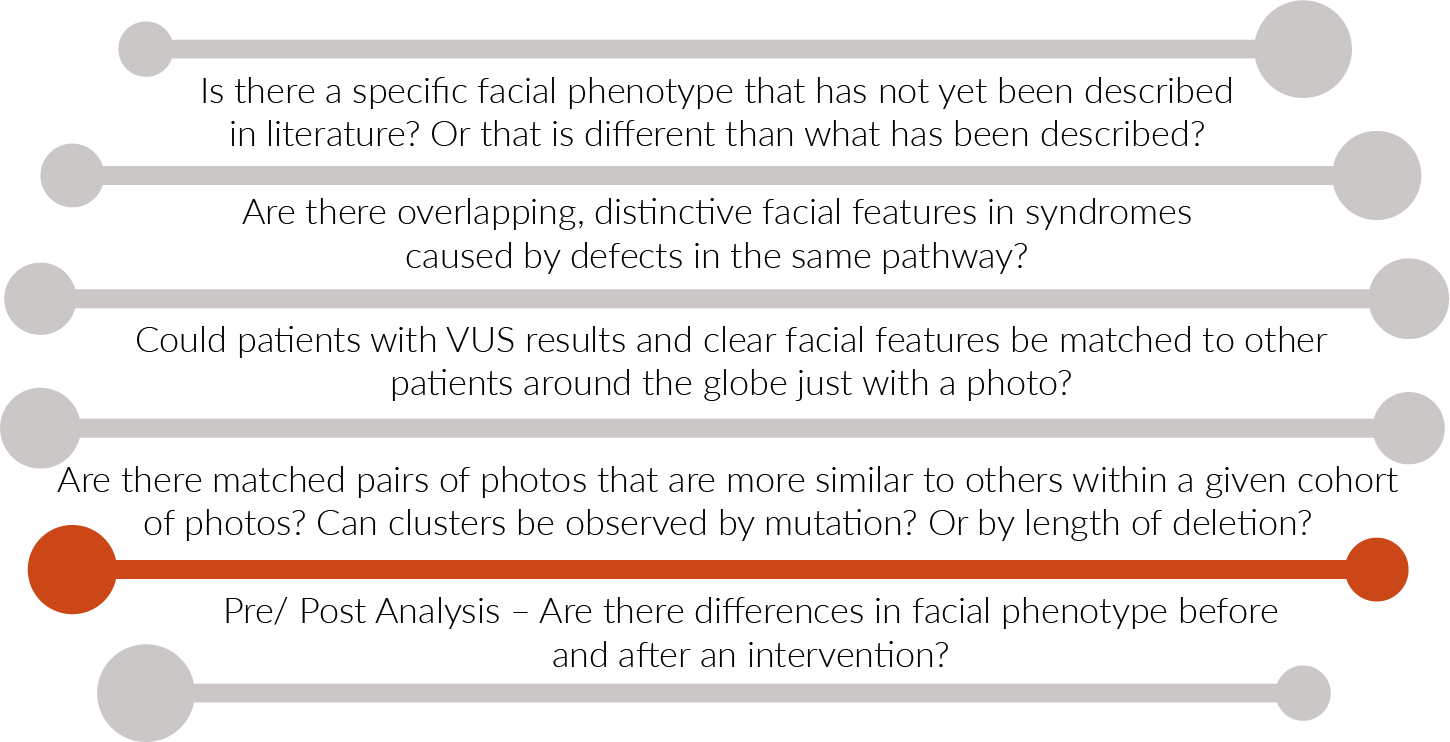
What kind of Research Questions?

What kind of Research Outputs?
1. Pairwise Clustermap
Input: Cases in Face2Gene CLINIC (grouping is possible).
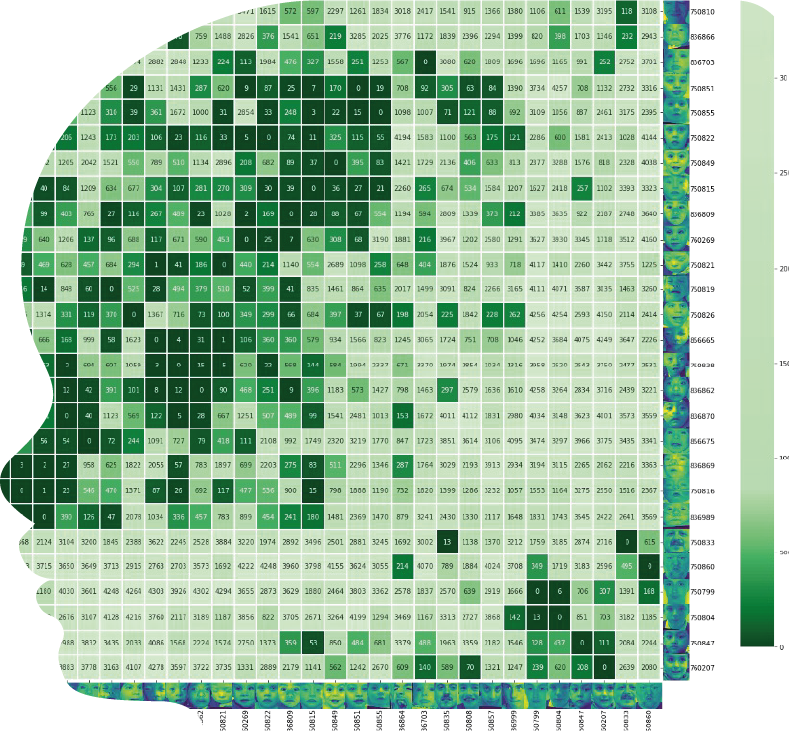
Output: Pairwise Clustermap where we compare each case to every case in the cohort (x and y axes) plus every image in our control gallery (4.3k photos); the number in the box is the similarity rank achieved.
Low numbers mean that the cohort is more similar amongst itself than compared to our control gallery.
A clustering algorithm is applied, and the resulting dendogram can be explored to check for subclusters (e.g. 6 subjects on the right vs 28 on the left).
2. tSNE or PCA visualization
Input: Cases in Face2Gene CLINIC (grouping is possible), with associated relevant clinical information.
.
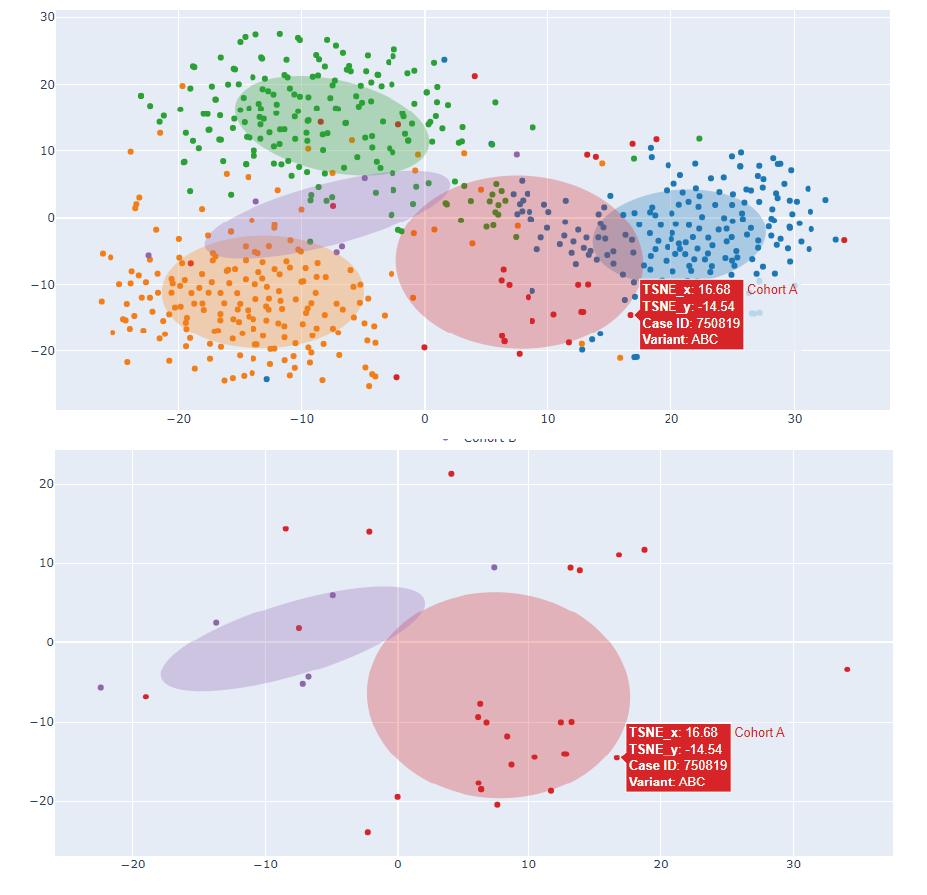
Output: Dimensionality reduction is applied to the photo vectors (tSNE or PCA) and a 2D or 3D representation in the Clinical Face Phenotype Space (CFPS) is obtained. Smaller distances in CFPS translate to more similar facial phenotypes. A confidence ellipse per cluster is also included.
The top-N similar syndromes in our database may also be represented (potential confounding syndromes/patient matching analyses).
Each data point can be matched to a subject via case ID, and additional relevant information may be included in the hover box.
3. Statistical Similarity Analysis
Input: Independent samples of age and gender-matched cases in Face2Gene CLINIC. FDNA may provide a control group.
Output: First, the similarity is computed between every pair of cases – intra and inter-cohorts.
Assumption checks are used to determine parametric/nonparametric testing: Normal distribution, equal variance and outliers.
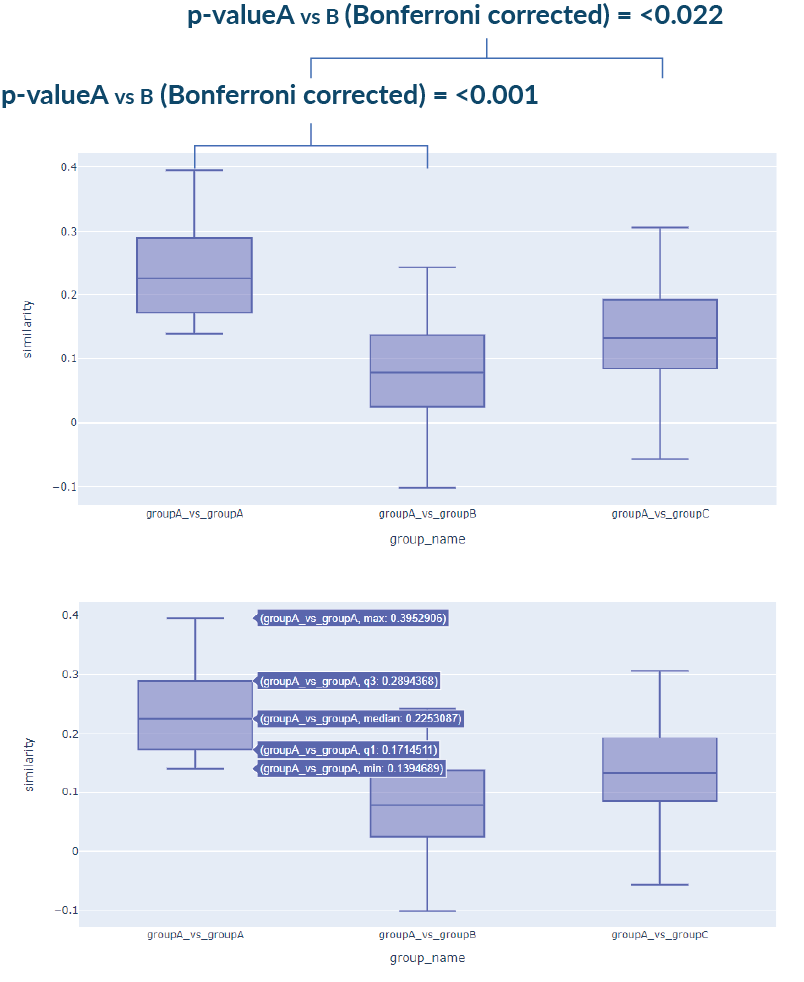
Adequate pairwise tests are then used to compare every two groups, correcting for multiple comparisons by applying the Bonferroni correction.
A boxplot visualization of the groups is also generated. Additional statistical information per group is shown on hover.
